Hackathon Projects
On the final day of the Hackathon, 9 awesome teams presented work-in-progress projects they had been hacking on, and we were so excited to see what they had already done and their ongoing momentum. Teams evolved throughout the Hackathon, some joined as a team and welcomed others, and other teams formed and merged throughout the week.
Hackathon participants will have 3 months of continued access to the 2i2c JupyterHub and Slack as they continue experimenting. This way we can all learn more about what the transition to the Cloud looks like (and costs) and support more researchers using NASA Earthdata on the Cloud.
Below is brief information about each project team, with links and screenshots from slides and notebooks in GitHub repos that they shared on the final day of the Hackathon.
Field Campaigns
Team: Tom Farrar, Kyla Drushka, Bia Villas Boas., Matthew Archer, Kathleen Dohan, Severine Fournier, Eli Hunter, John Wilkin
Primary Helpers: Jinbo Wang, Jack McNelis, Ed Armstrong
Slides; GitHub: https://github.com/NASA-Openscapes/nch2021-projects-contexdata
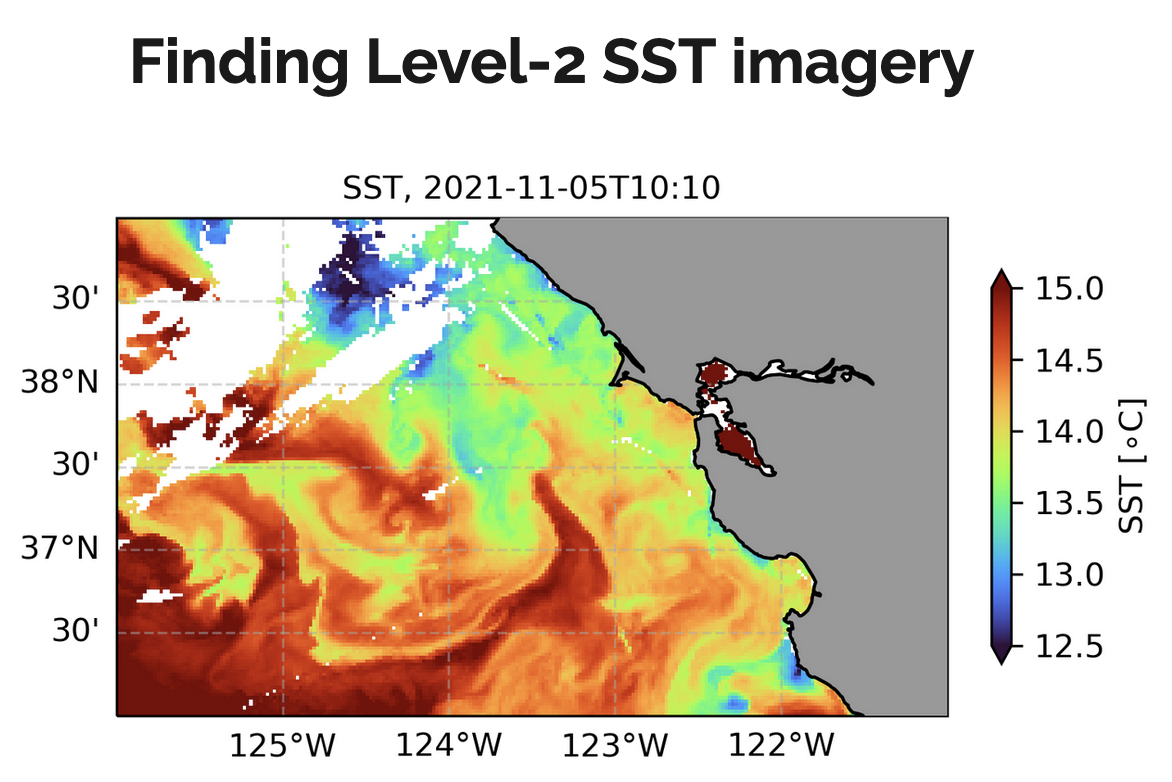
Project Goals: Extract and visualize multiple data sets that can be used to give context to field campaigns or other regional events (e.g., the “Warm Blob” or the recent atmospheric river event on the West Coast). For example, choose a target region and time period, cycle through all available high-resolution sea surface temperature data, identify clear images, catalog them. Extract wind, wave, sea surface height, salinity data.
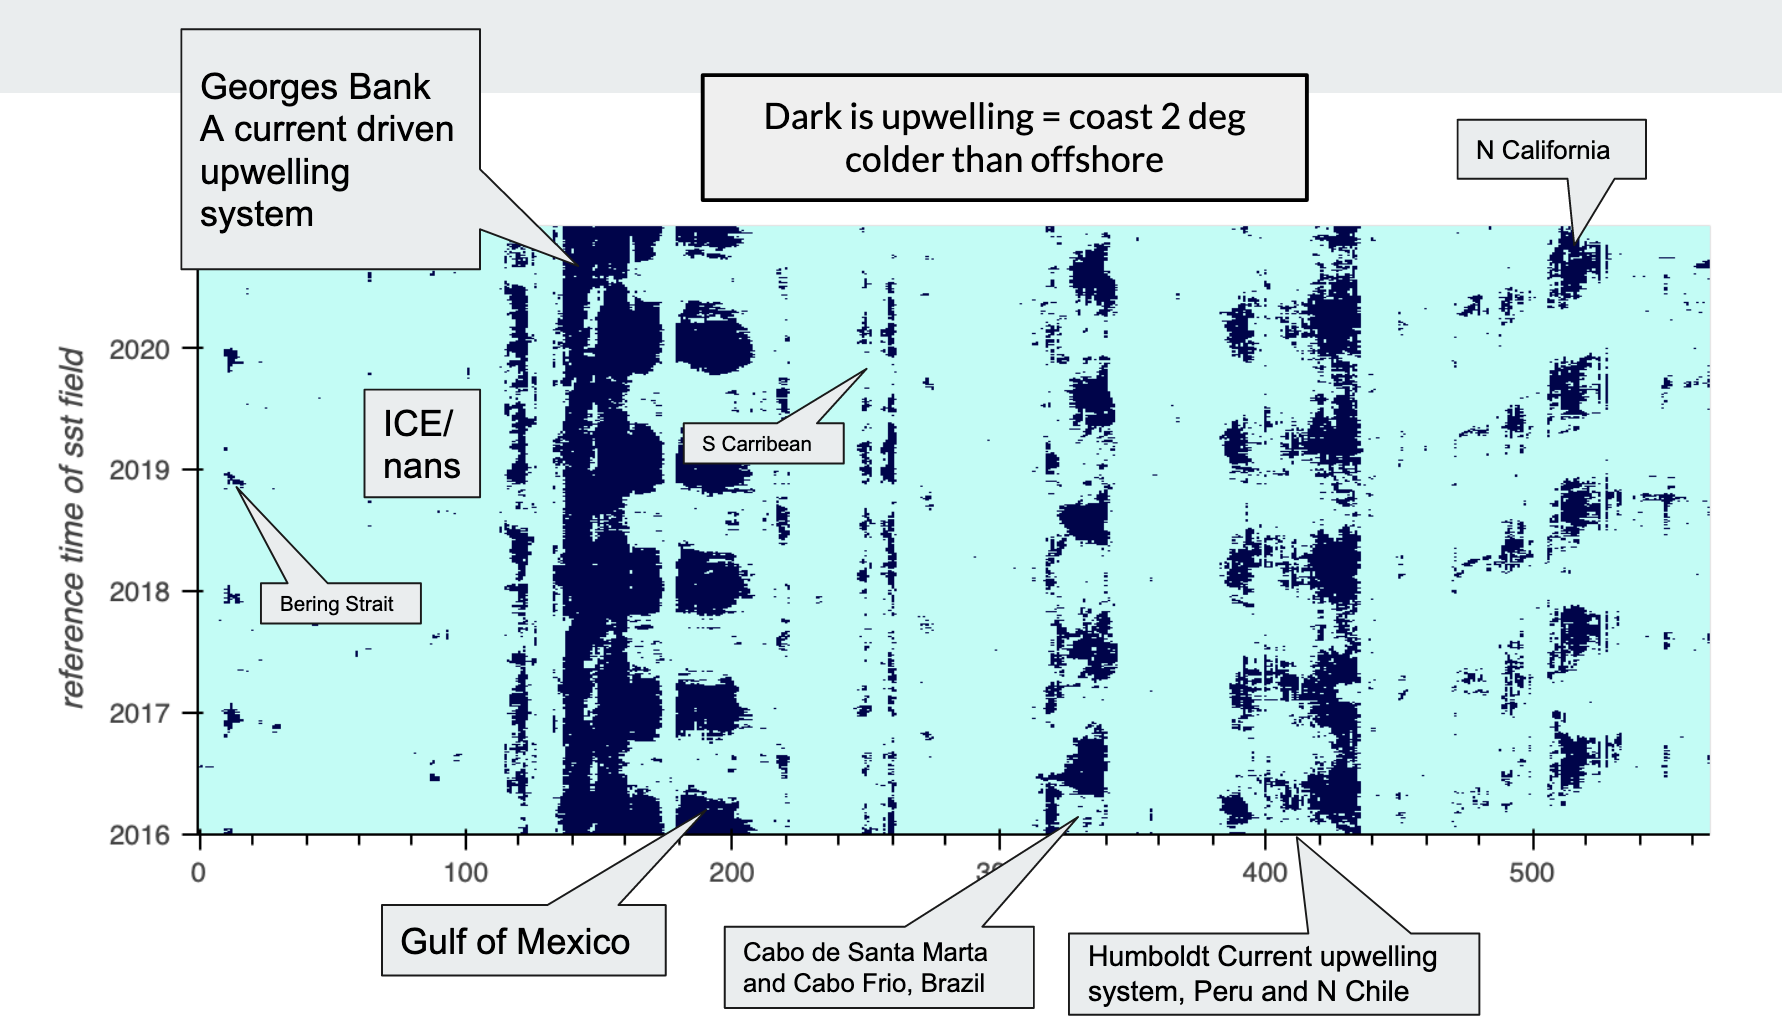
Global Upwelling Patterns
Team: Eli Holmes, Jorge Vazquez
Primary Helpers: Aaron Friesz, Andy Barrett, Jack McNelis
Slides, GitHub: https://github.com/NASA-Openscapes/nhw21-projects-upwelling, Notebook: http://nbviewer.org/github/NASA-Openscapes/nhw21-projects-upwelling/blob/main/notebooks/05-Multi-year-upi-plots.ipynb
Project Goals: Climate change is predicted to change coastal upwelling. This study explores the use of simple SST metrics for studying upwelling signatures.
Also: Running the NASA Cloud Workshop notebooks with mybinder.org - by Eli Holmes, 2021 Cloud Hackathon Participant who then set up working in Binder
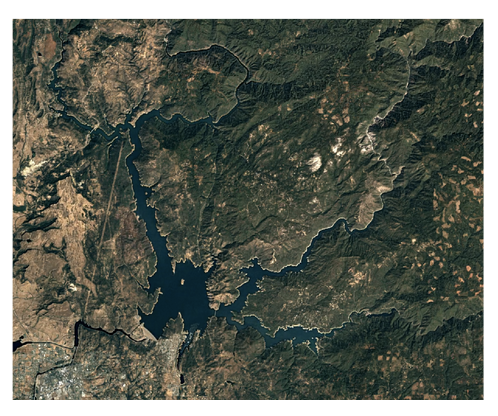
Surface Body Water
Team: Matthew Bonnema, Maximilian Parzen
Slides, GitHub: https://github.com/pz-max/NASA_projectX
Project Goals: Estimate surface area of surface water body and track changes over time. Test Case: Oroville Reservoir, California
Pypsicle: cryo computing in the cloud
Team: Chad Greene, Susan Howard, Luis Lopez, Cassandra Nickles, Christine Sadlik, Jessica Scheick
Primary Helpers: Luis Lopez
Slides, GitHub: https://github.com/NASA-Openscapes/nch2021-projects-pypsicle, Notebook: https://nbviewer.org/github/NASA-Openscapes/nch2021-projects-pypsicle/blob/main/S3-h5_example_rendered.ipynb
Project Goals: Selectively read in part of an hdf5 file, explore a dataset on the cloud
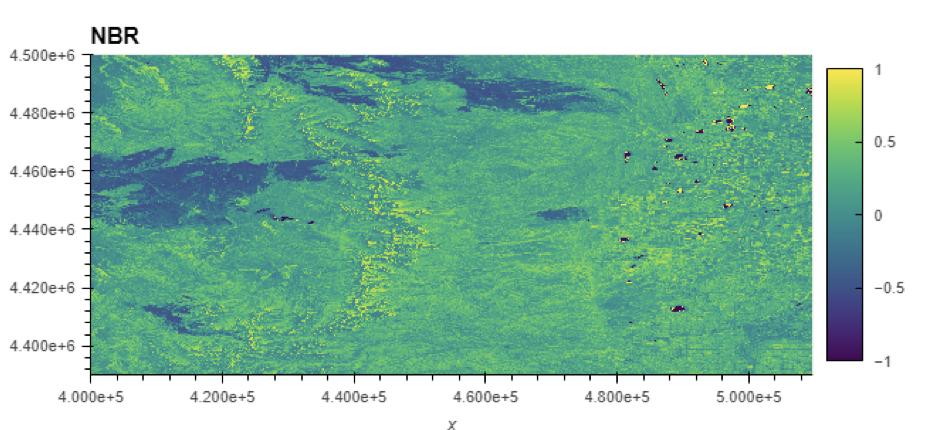
Query stact for HLS data and load as a time series
Team: Todd Hawbaker, Jodi Riegle, and Kehan Yang
Slides; GitHub: https://github.com/tjhawbaker/nch21_hls_timeseries
Project Goals: A cloud-deployable framework to identify burned areas in the harmonized Landsat Sentinel-2 data, and possibly other remotely sensed data sources. Basically, extending what we’ve done with Landsat to HLS data (Hawbaker et. al., 2020). The end product we are planning is code or a container that users could run in the cloud to generate a time series of burned area products for their area of interest.
Drought Monitor
Team: Colin Brust, Arthur Endsley
Project Goals: Build a data pipeline library that clips, reprojects and aggregates a given dataset to a desired spatial and temporal resolution. Then, use this library to feed GHRSST data into a neural network that forecasts changes in the U.S. Drought Monitor.
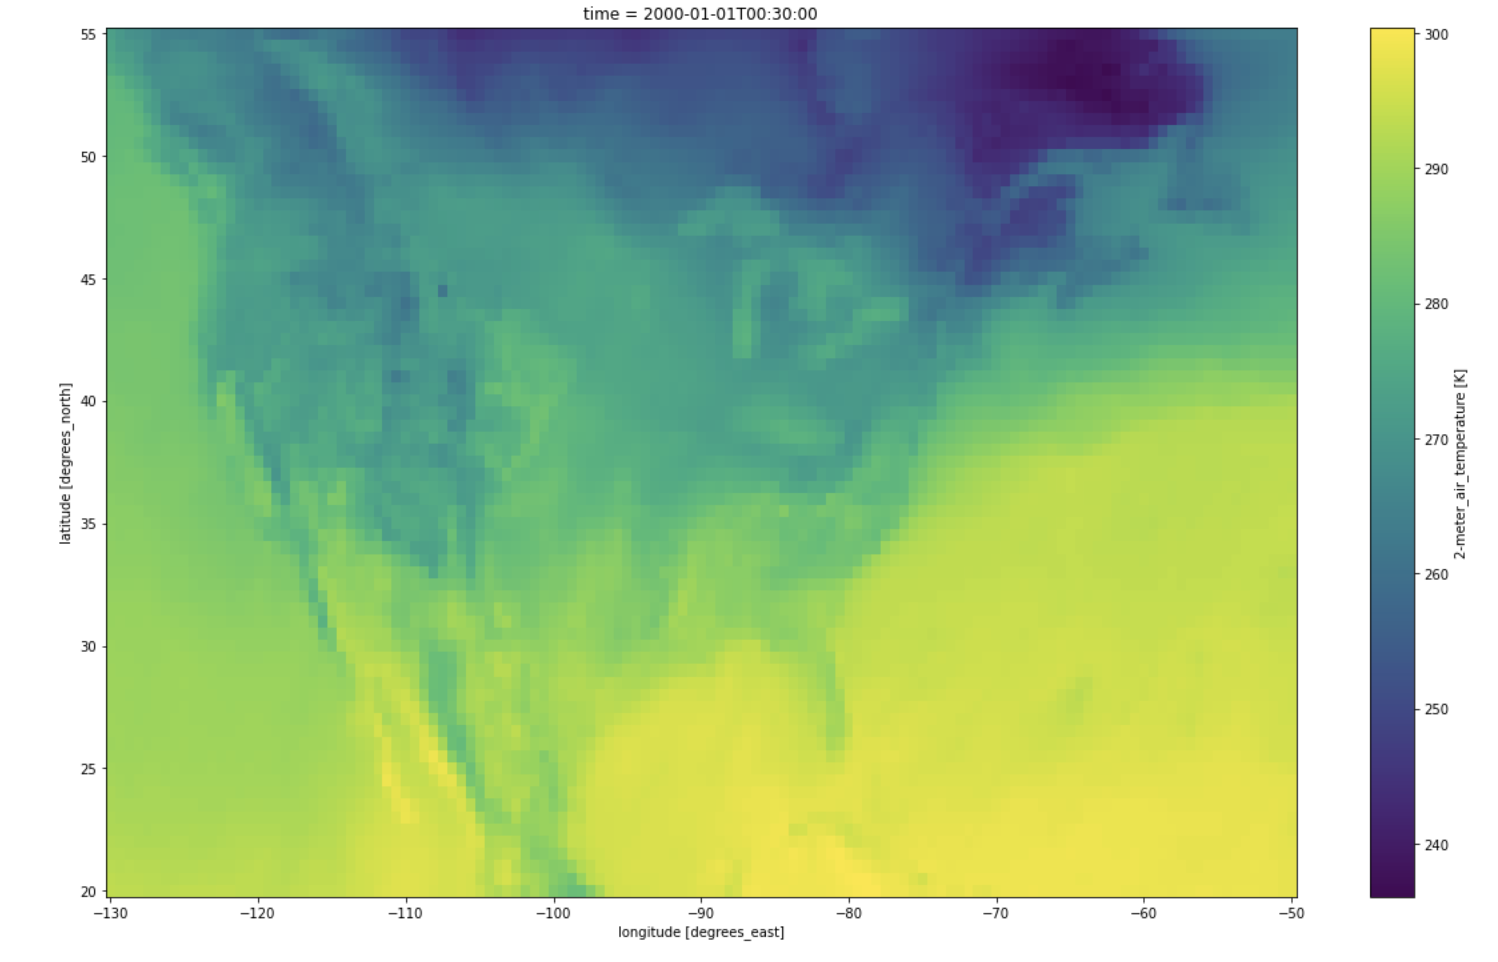
County Temperatures
Team: Binita KC, Xiaohua Pan
Primary Helpers: Alexis Hunzinger
GitHub: https://github.com/NASA-Openscapes/nch21-projects-counties-temp, Notebook: https://github.com/NASA-Openscapes/nch21-projects-counties-temp/blob/main/Project9.ipynb
Project Goals: Read the hourly MERRA-2 data from the GES DISC S3 bucket, subset by temperature and calculate the monthly average, ideally extract zonal mean using county shapefile
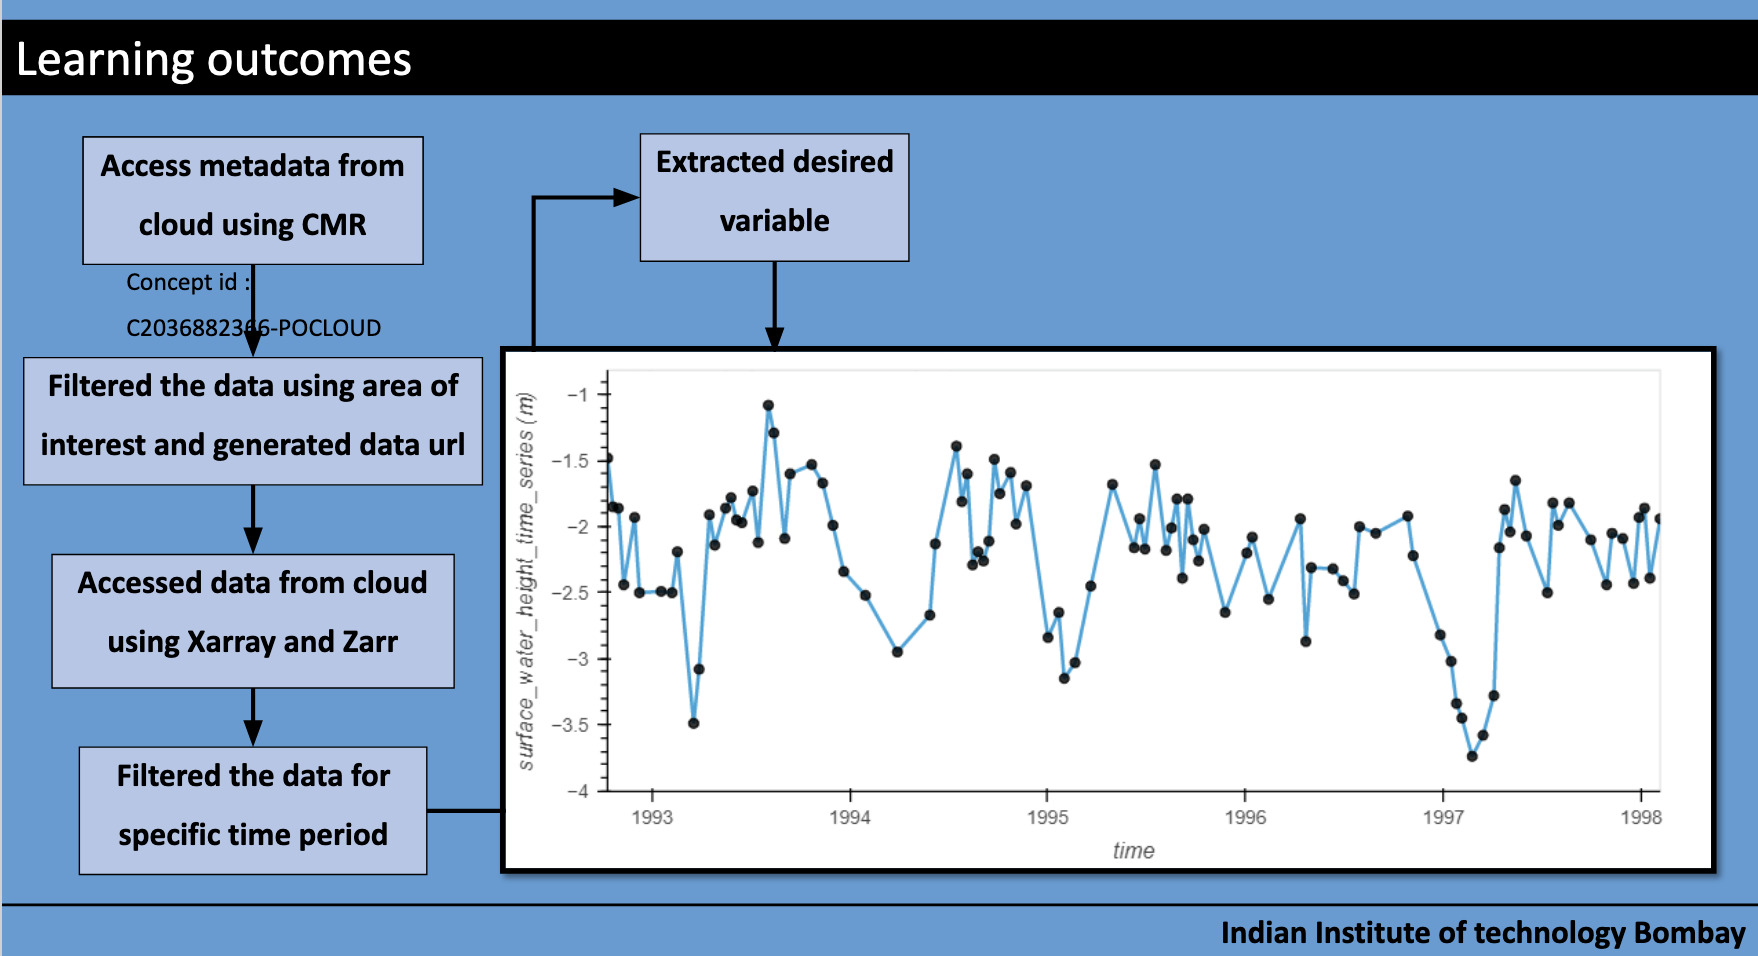
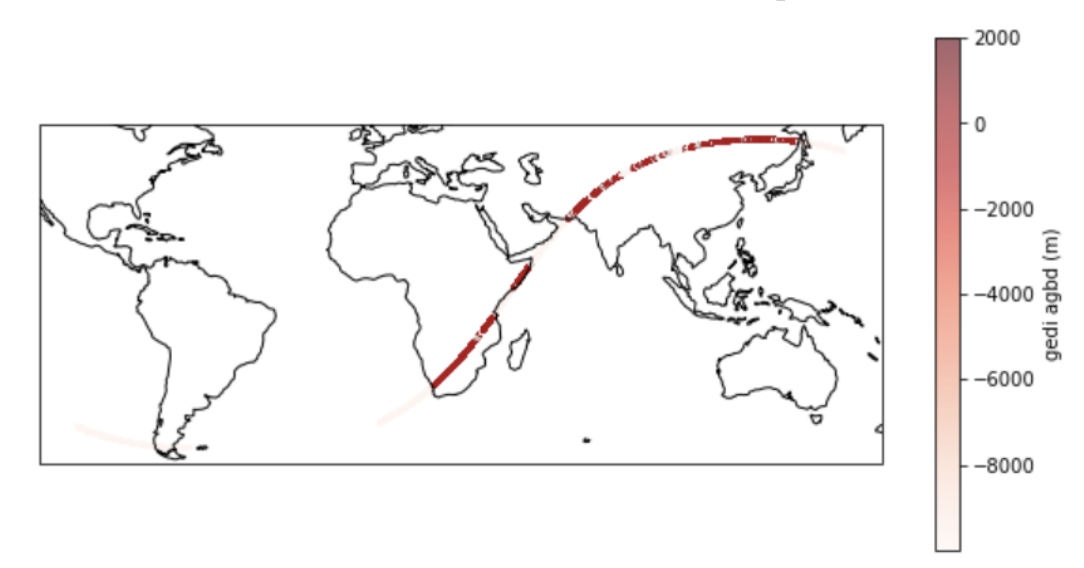
Retrieval of Pre SWOT data
Team: Prof. J. Indu, Kaushlendra V., Nitish K., Manu K.S., Girish P.
Project Goals: To access multi-mission altimetry data sets and merge them to generate high temporal resolution altimetry data