Plot map of ICESat-2 tracks using cartopy

Uses GIBS Blue Marble with Terrain Shading (see https://nasa-gibs.github.io/gibs-api-docs/available-visualizations/)

pip install owslib
Collecting owslib
  Using cached OWSLib-0.32.0-py2.py3-none-any.whl.metadata (6.6 kB)
Requirement already satisfied: lxml in /srv/conda/envs/notebook/lib/python3.10/site-packages (from owslib) (5.1.0)
Requirement already satisfied: python-dateutil in /srv/conda/envs/notebook/lib/python3.10/site-packages (from owslib) (2.8.2)
Requirement already satisfied: pyyaml in /srv/conda/envs/notebook/lib/python3.10/site-packages (from owslib) (6.0.1)
Requirement already satisfied: requests in /srv/conda/envs/notebook/lib/python3.10/site-packages (from owslib) (2.31.0)
Requirement already satisfied: six>=1.5 in /srv/conda/envs/notebook/lib/python3.10/site-packages (from python-dateutil->owslib) (1.16.0)
Requirement already satisfied: charset-normalizer<4,>=2 in /srv/conda/envs/notebook/lib/python3.10/site-packages (from requests->owslib) (3.3.2)
Requirement already satisfied: idna<4,>=2.5 in /srv/conda/envs/notebook/lib/python3.10/site-packages (from requests->owslib) (3.6)
Requirement already satisfied: urllib3<3,>=1.21.1 in /srv/conda/envs/notebook/lib/python3.10/site-packages (from requests->owslib) (1.26.18)
Requirement already satisfied: certifi>=2017.4.17 in /srv/conda/envs/notebook/lib/python3.10/site-packages (from requests->owslib) (2024.2.2)
Using cached OWSLib-0.32.0-py2.py3-none-any.whl (240 kB)
Installing collected packages: owslib
Successfully installed owslib-0.32.0
Note: you may need to restart the kernel to use updated packages.
import matplotlib.pyplot as plt
import matplotlib.patches as mpatches

import cartopy.crs as ccrs
import cartopy.feature as cfeature

from cartopy.io import srtm, PostprocessedRasterSource, LocatedImage
from cartopy.io.srtm import SRTM3Source, SRTM1Source

import cartopy.io.img_tiles as cimgt

from owslib.wmts import WebMapTileService

from shapely import box, Polygon

import earthaccess
proj = ccrs.AlbersEqualArea(central_latitude=23., central_longitude=-96., standard_parallels=[29.5, 45.5])
extent = [-7096284.71, 7105582.09, 92407.95, 4785334.02]
colorado_extent = [-110., -102., 37., 41.]

bbox = box(-105.5,40,-105,41.)
result = earthaccess.search_data(
    short_name="ATL03",
    bounding_box=(-105.5,40,-105,41.),
    temporal=("2020-04-27","2020-05-28"),
    version="006",
    cloud_hosted=True,
)
Granules found: 1
boundary = result[0]["umm"]["SpatialExtent"]["HorizontalSpatialDomain"]["Geometry"]["GPolygons"][0]["Boundary"]["Points"]
boundary_poly = Polygon([point.values() for point in boundary])
url = 'https://gibs.earthdata.nasa.gov/wmts/epsg4326/best/wmts.cgi'
wmts = WebMapTileService(url)

layers = ['BlueMarble_ShadedRelief']
date_str = '2020-05-15'

# Create a feature for States/Admin 1 regions at 1:50m from Natural Earth
states_provinces = cfeature.NaturalEarthFeature(
        category='cultural',
        name='admin_1_states_provinces_lines',
        scale='50m',
        facecolor='none',
        edgecolor='0.7')

populated_places = cfeature.NaturalEarthFeature(category='cultural', 
                                                name='populated_places',
                                                scale='10m')

fig = plt.figure(figsize=(8,5))
ax = fig.add_subplot(projection=proj)
ax.add_feature(states_provinces)  #, edgecolor='0.7')

ax.set_extent(colorado_extent, ccrs.Geodetic())

ax.add_geometries([bbox], ccrs.PlateCarree(), edgecolor=None, facecolor="cyan", alpha=0.5, label="Area of Interest")
ax.add_geometries([boundary_poly], ccrs.PlateCarree(), edgecolor=None, facecolor="lightgreen", alpha=0.5, label="ATL03 Ground Track")

ax.add_wmts(wmts, layers[0], wmts_kwargs={'time': date_str})

aoi = mpatches.Patch(color='cyan', alpha=0.5, label='Area of Interest')
footprint = mpatches.Patch(color="lightgreen", alpha=0.5, label="ATL03 Ground Track")
ax.legend(handles=[aoi, footprint], loc='lower left')

marker = [".", "*"]
annotate = [False, True]
color = ['k', 'k']
size = [30, 80]
fontsize = []

add_cities(gdf.groupby("plot_code"), marker=marker, annotate=annotate, color=color, markersize=size)

fig.tight_layout()

fig.savefig("images/atl03_ground_track_and_bbox.png")
/srv/conda/envs/notebook/lib/python3.10/site-packages/owslib/wmts.py:860: FutureWarning: The behavior of this method will change in future versions. Use specific 'len(elem)' or 'elem is not None' test instead.
  if current and current.text == 'true':
/srv/conda/envs/notebook/lib/python3.10/site-packages/owslib/wmts.py:657: RuntimeWarning: TileMatrixLimits with tileMatrix "1" already exists
  warnings.warn(msg, RuntimeWarning)
/srv/conda/envs/notebook/lib/python3.10/site-packages/owslib/wmts.py:657: RuntimeWarning: TileMatrixLimits with tileMatrix "2" already exists
  warnings.warn(msg, RuntimeWarning)
/srv/conda/envs/notebook/lib/python3.10/site-packages/owslib/wmts.py:657: RuntimeWarning: TileMatrixLimits with tileMatrix "3" already exists
  warnings.warn(msg, RuntimeWarning)
/srv/conda/envs/notebook/lib/python3.10/site-packages/owslib/wmts.py:657: RuntimeWarning: TileMatrixLimits with tileMatrix "4" already exists
  warnings.warn(msg, RuntimeWarning)
/srv/conda/envs/notebook/lib/python3.10/site-packages/owslib/wmts.py:657: RuntimeWarning: TileMatrixLimits with tileMatrix "5" already exists
  warnings.warn(msg, RuntimeWarning)
/srv/conda/envs/notebook/lib/python3.10/site-packages/owslib/wmts.py:657: RuntimeWarning: TileMatrixLimits with tileMatrix "6" already exists
  warnings.warn(msg, RuntimeWarning)

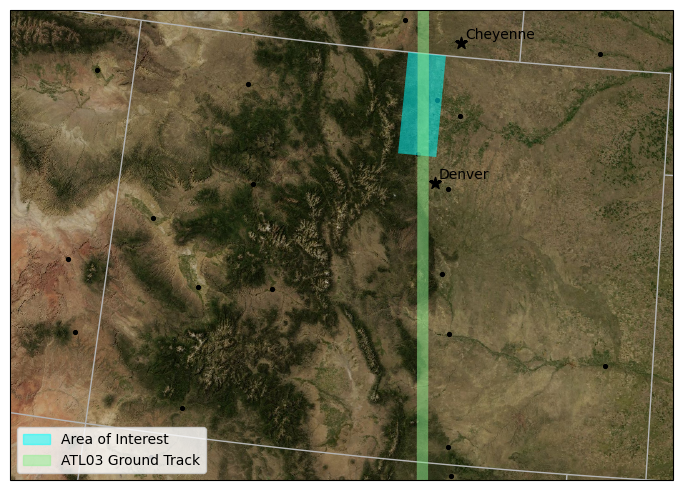
Load and subset Populated Places from Natural Earth

import cartopy.io.shapereader as shpr
import geopandas as gpd

fname = shpr.natural_earth(resolution='10m', category='cultural', name='populated_places')

gdf = gpd.read_file(fname).to_crs(ax.projection.proj4_init)  # load and convert to CRS
gdf = gdf[gdf.geometry.within(box(*[ax.get_extent()[i] for i in [0,2,1,3]]))]
gdf["plot_code"] = gdf["FEATURECLA"].isin(['Admin-1 capital', 'Admin-1 region capital', 'Admin-0 region capital', 
                                         'Admin-0 capital', 'Admin-0 capital alt'])
def add_cities(grouper, ax=None, marker=None, annotate=None, color=None, markersize=None, fontsize=None):
    """Adds cities and lebels by group to a plot"""

    if not ax:
        ax = plt.gca()

    ngroup = grouper.ngroups
    if not marker:
        marker = [marker] * ngroup  # Create an array of markers
    if not annotate:
        annotate = [annotate] * ngroup
    if not color:
        color = [color] * ngroup
    if not markersize:
        markersize = [markersize] * ngroup
    if not fontsize:
        fontsize = [fontsize] * ngroup

    for (name, group), mrkr, ann, c, ms, fs in zip(gdf.groupby("plot_code"), marker, annotate, color, markersize, fontsize):
        group.plot(ax=ax, marker=mrkr, color=c, markersize=ms)

        if ann:
            for x, y, label in zip(group.geometry.x, group.geometry.y, group.NAME):
                ax.annotate(label, xy=(x, y), xytext=(3, 3), textcoords="offset points", fontsize=fs)